Nate Silver’s The Signal and the Noise is a bit of a slog. That chapter on baseball and earthquakes, though. Wow. I see overfitting everywhere since reading it.
Baseball
Say you’re evaluating how well baseball players perform as they age. You track 27 players and get these results:
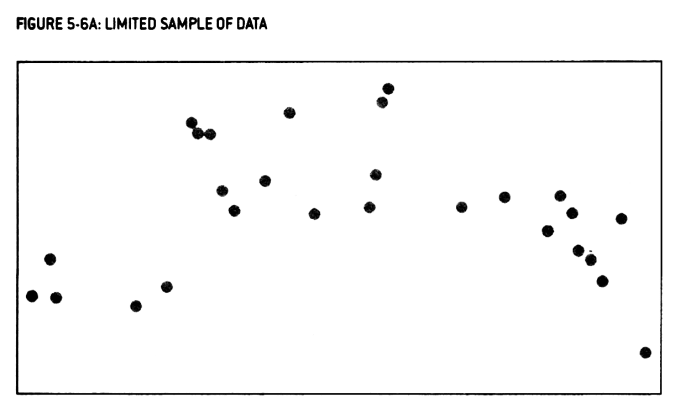
Many of us have an inclination to overfit the data: we pull a pattern out that only (barely) exists because the sample size was small. An overfit model of the above might look like this:
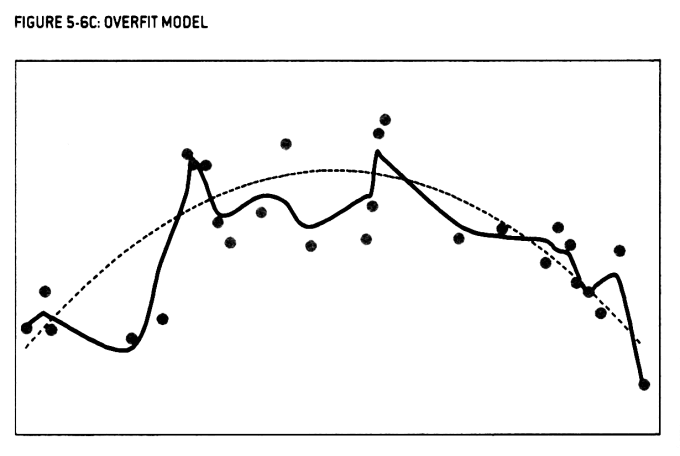
This is much like flipping a coin five times, getting tails four of those times, then concluding that a coin toss favours tails 80% of the time.
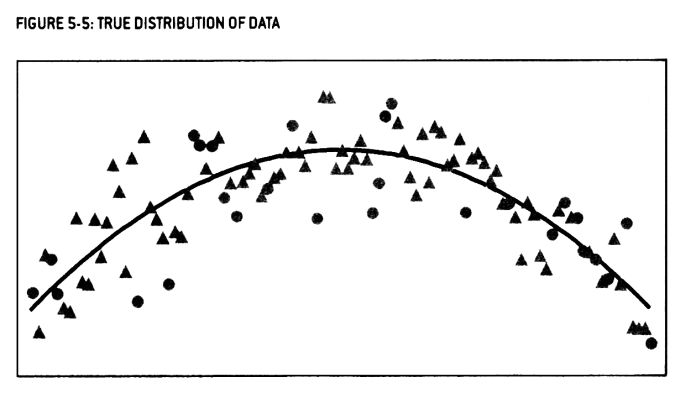
Add more data—more coin flips or baseball players—and you’ll often see that a simpler, smoother, curve appears:
Earthquakes
Seismologists track the magnitude and frequency of earthquakes over time. Unlike baseball however, patterns in magnitude and frequency can take centuries to play out.
Some seismologists play “connect the dots” anyway. They reverse-engineer a formula and/or fall victim to confirmation bias; finding reproducible signals in nature for why those events happened when they did. They use these complex formulas and signals to predict future earthquakes, often down to the day. Or the opposite; they predict when earthquakes won’t happen.
The 2011 magnitude 9.1 earthquake in Japan (the Fukushima one) was one of these cases. Seismologists had used an overfit model to determine such an earthquake might only occur once every 13,000 years.
Had they followed the more boring, straight-lined, Gutenberg-Richter law? Once every 130 years.